The work we do involves a lot imaging and much of the quantitative aspects involve hand measurements. I am currently in unpaid surprise sabbatical and I have always wanted to learn how to use machine learning approaches to segment / cluster / specify image features but haven’t managed to scrounge up the spare time - so here we go!
To make my life far more difficult, I’m going to try to segment fundus imagery.
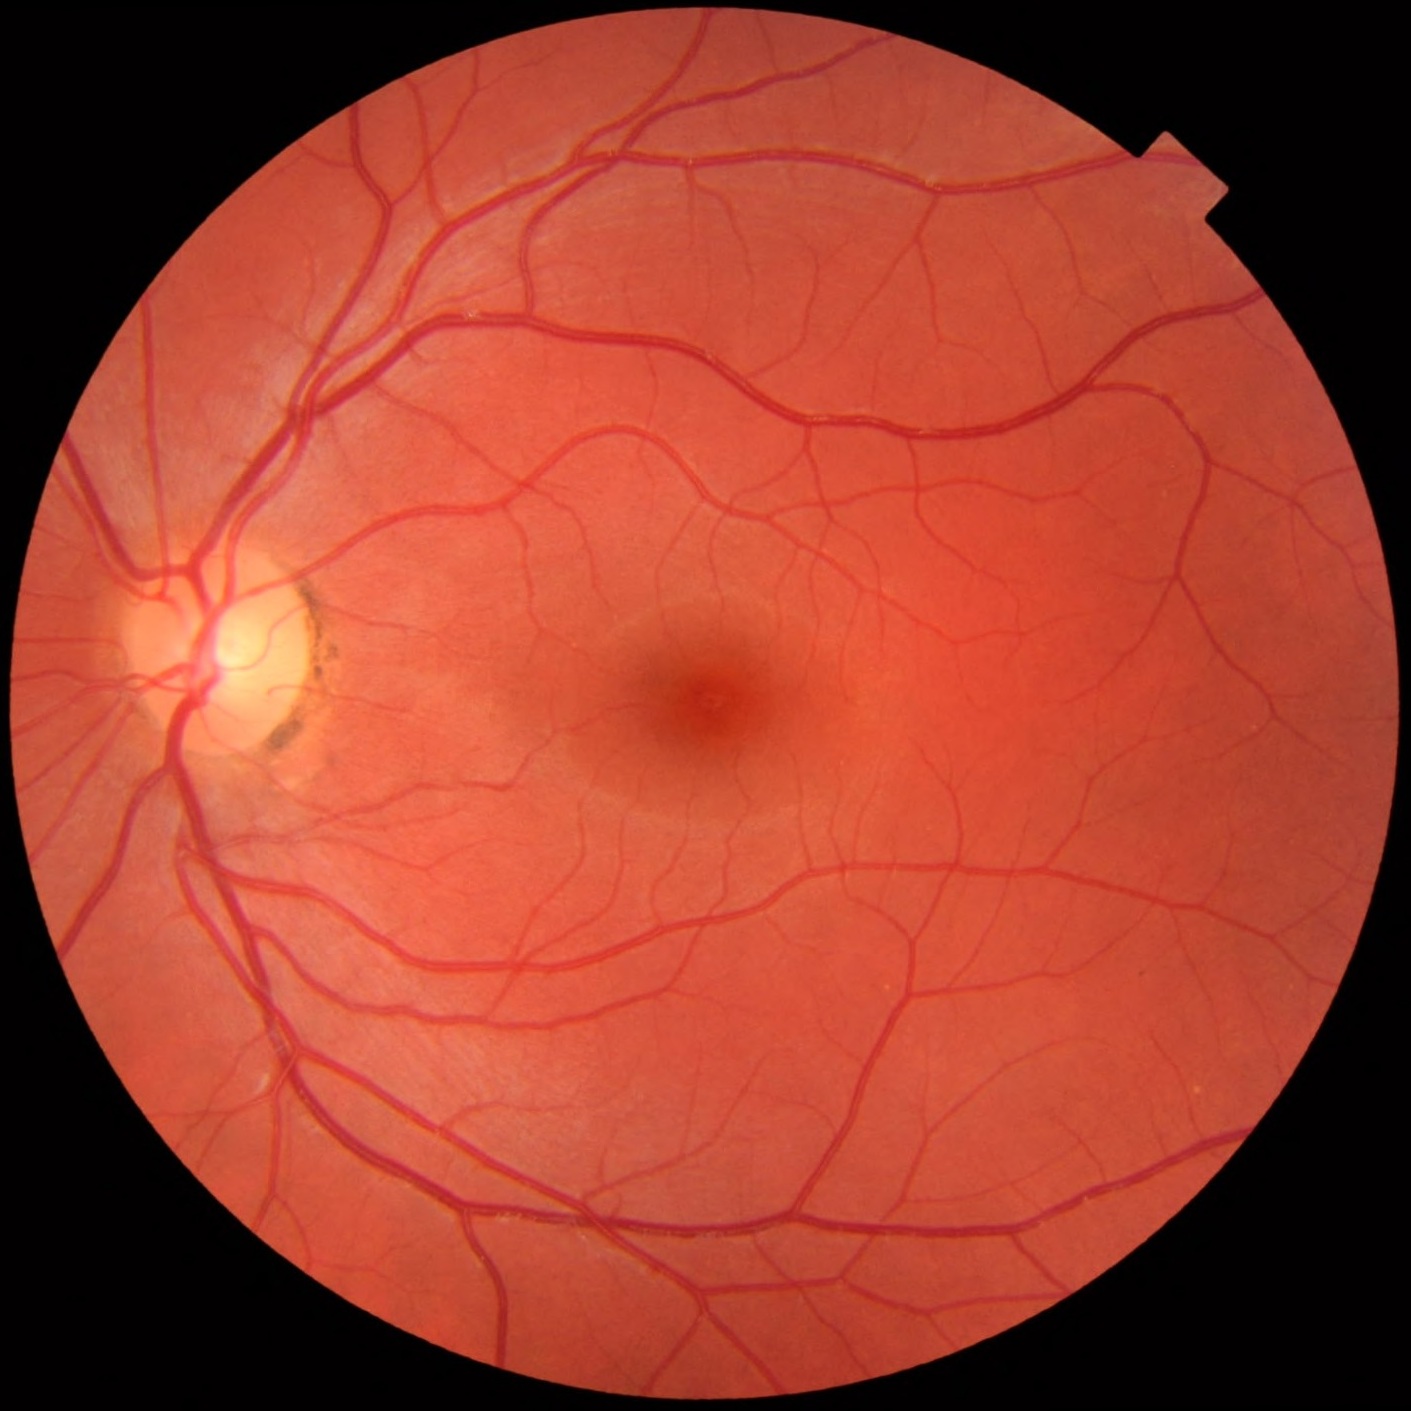
3 Retina Fundus
Retina
The fundus is the back of the eye (opposite the lens). That’s where the retina is. The retina is the part of your eye which turns light into signal for your brain to turn into images. Fundus photography is a non-invasive imaging technique which is used to help assess retinal health.
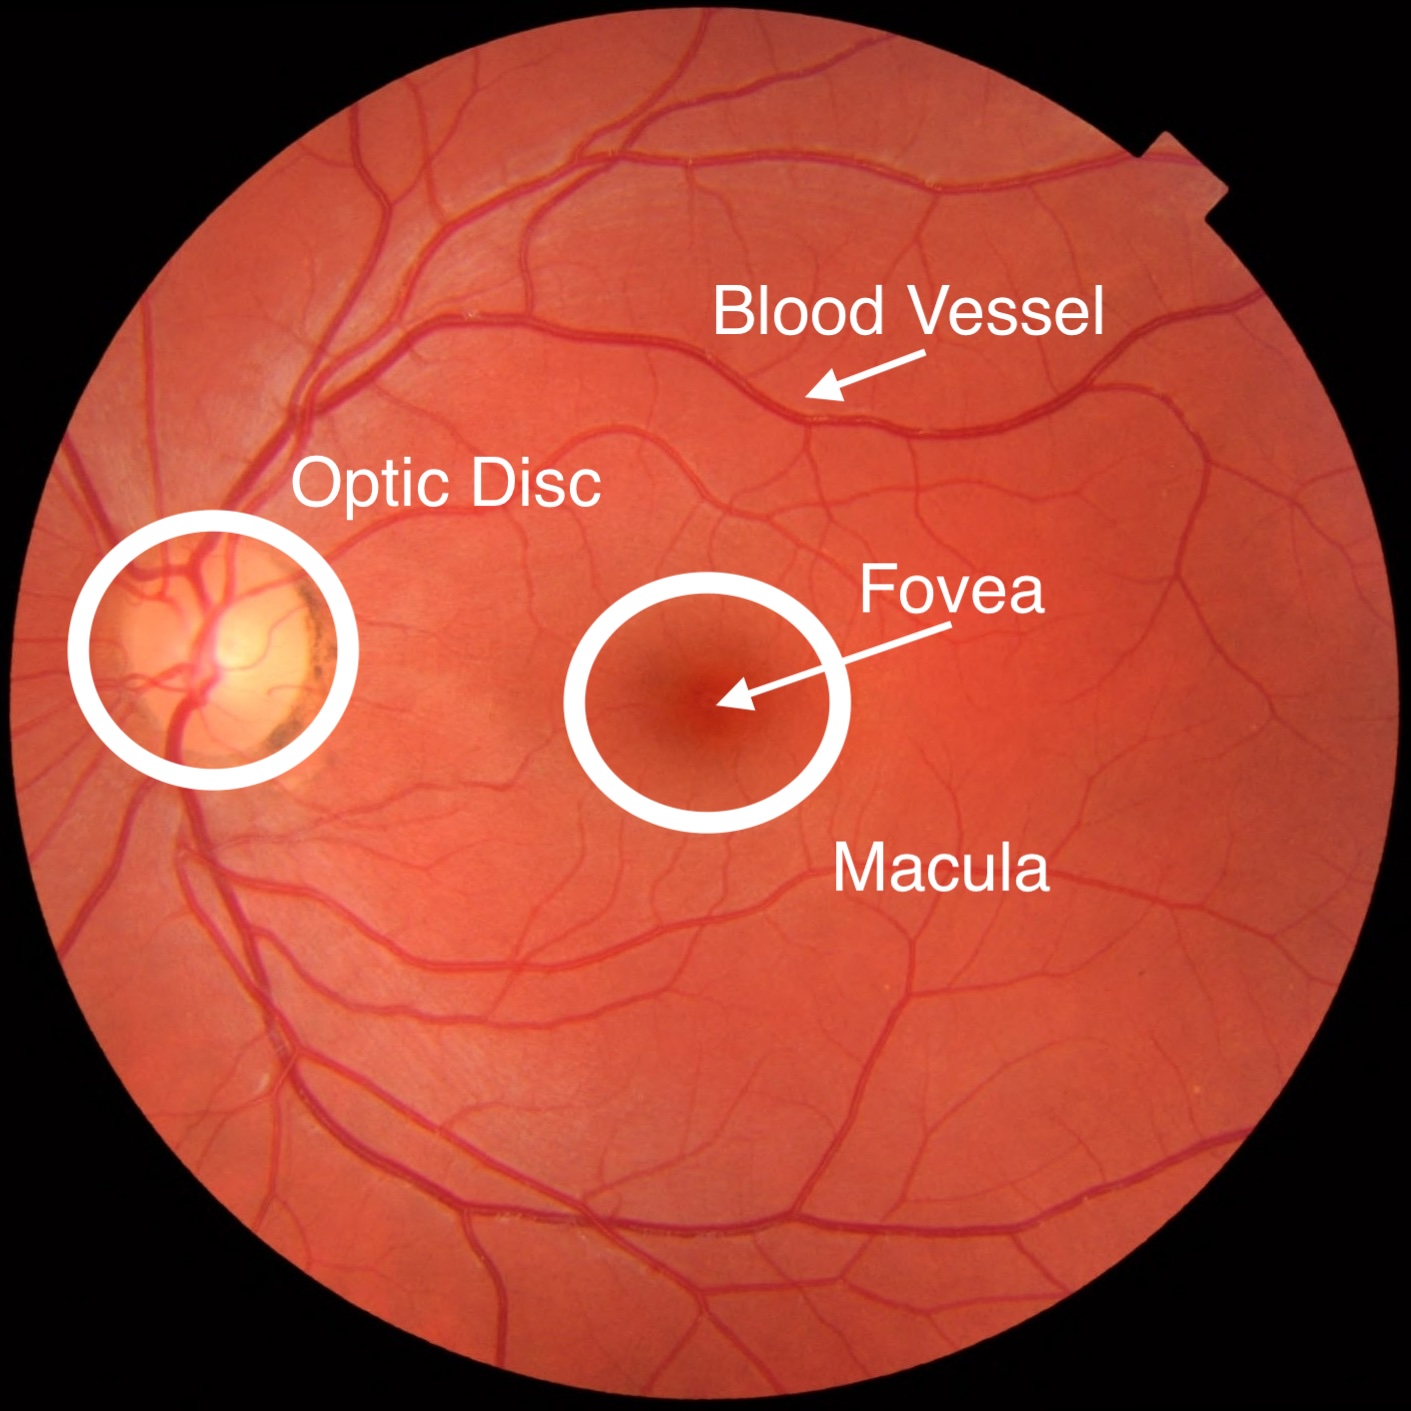
4 Main features
Retina Annotated
The macula / fovea is a the cone-rich segment where humans get their high visual acuity (this structure is “missing” in most other species). The optic disk is where the neurons go to send the visual information to the brain.
You cannot run the commented out code below in Rstudio as the inline editor cannot handle user clicks. So you have to copy/paste and run this in the Console.
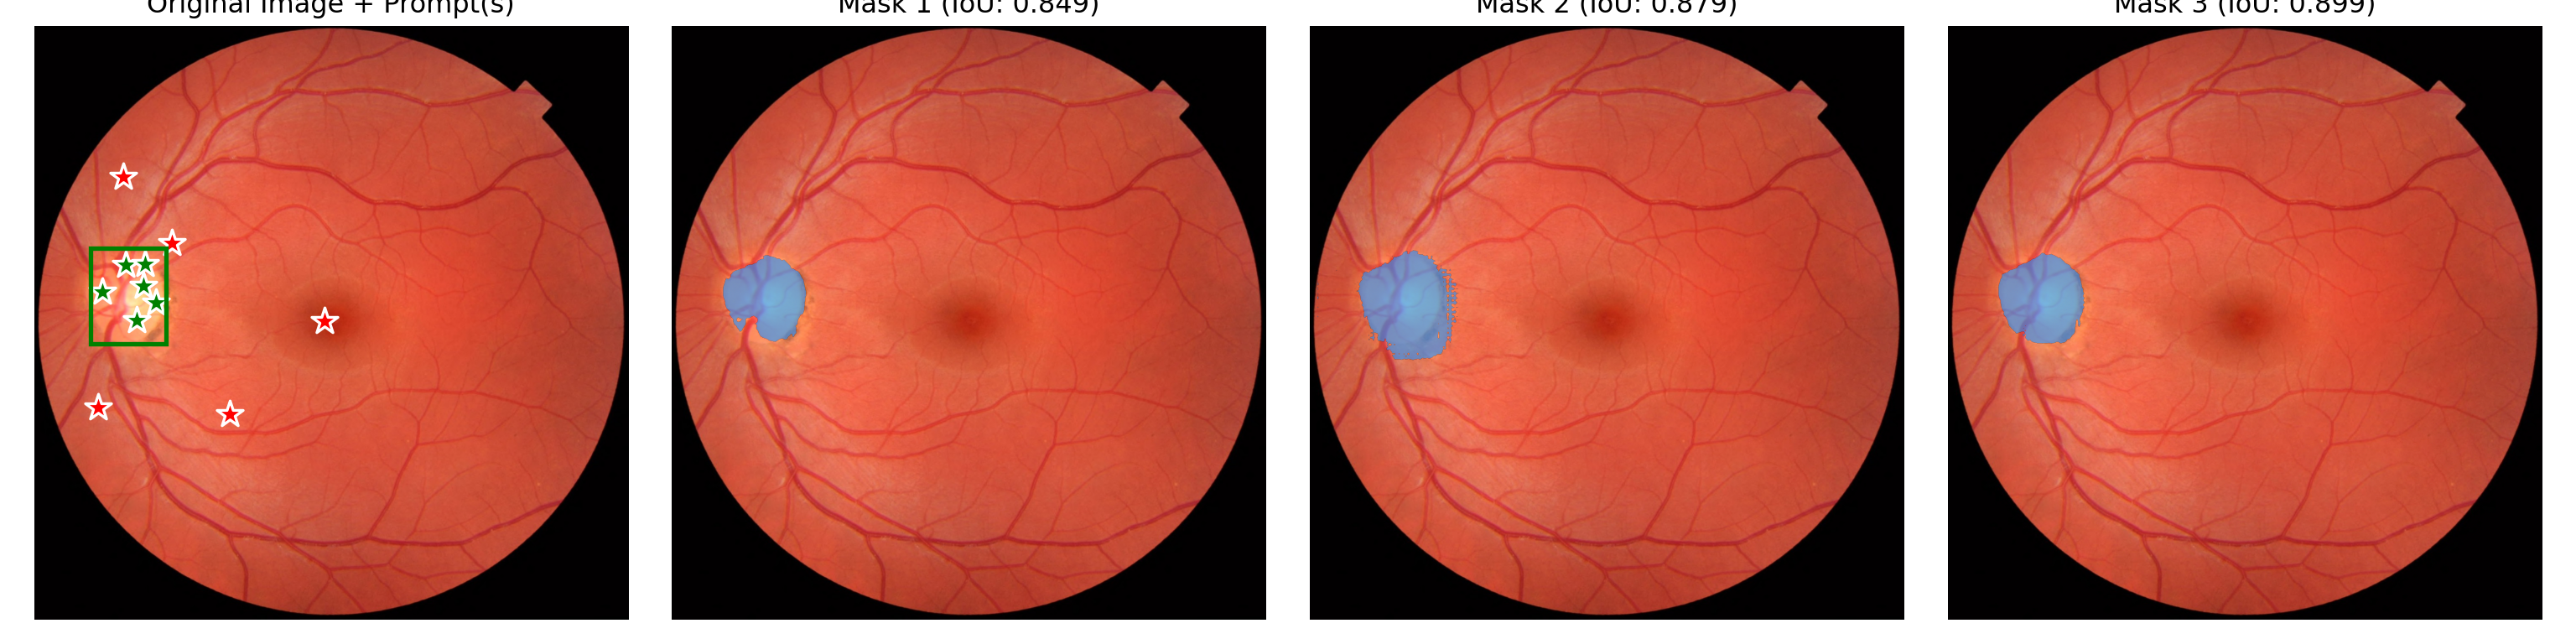
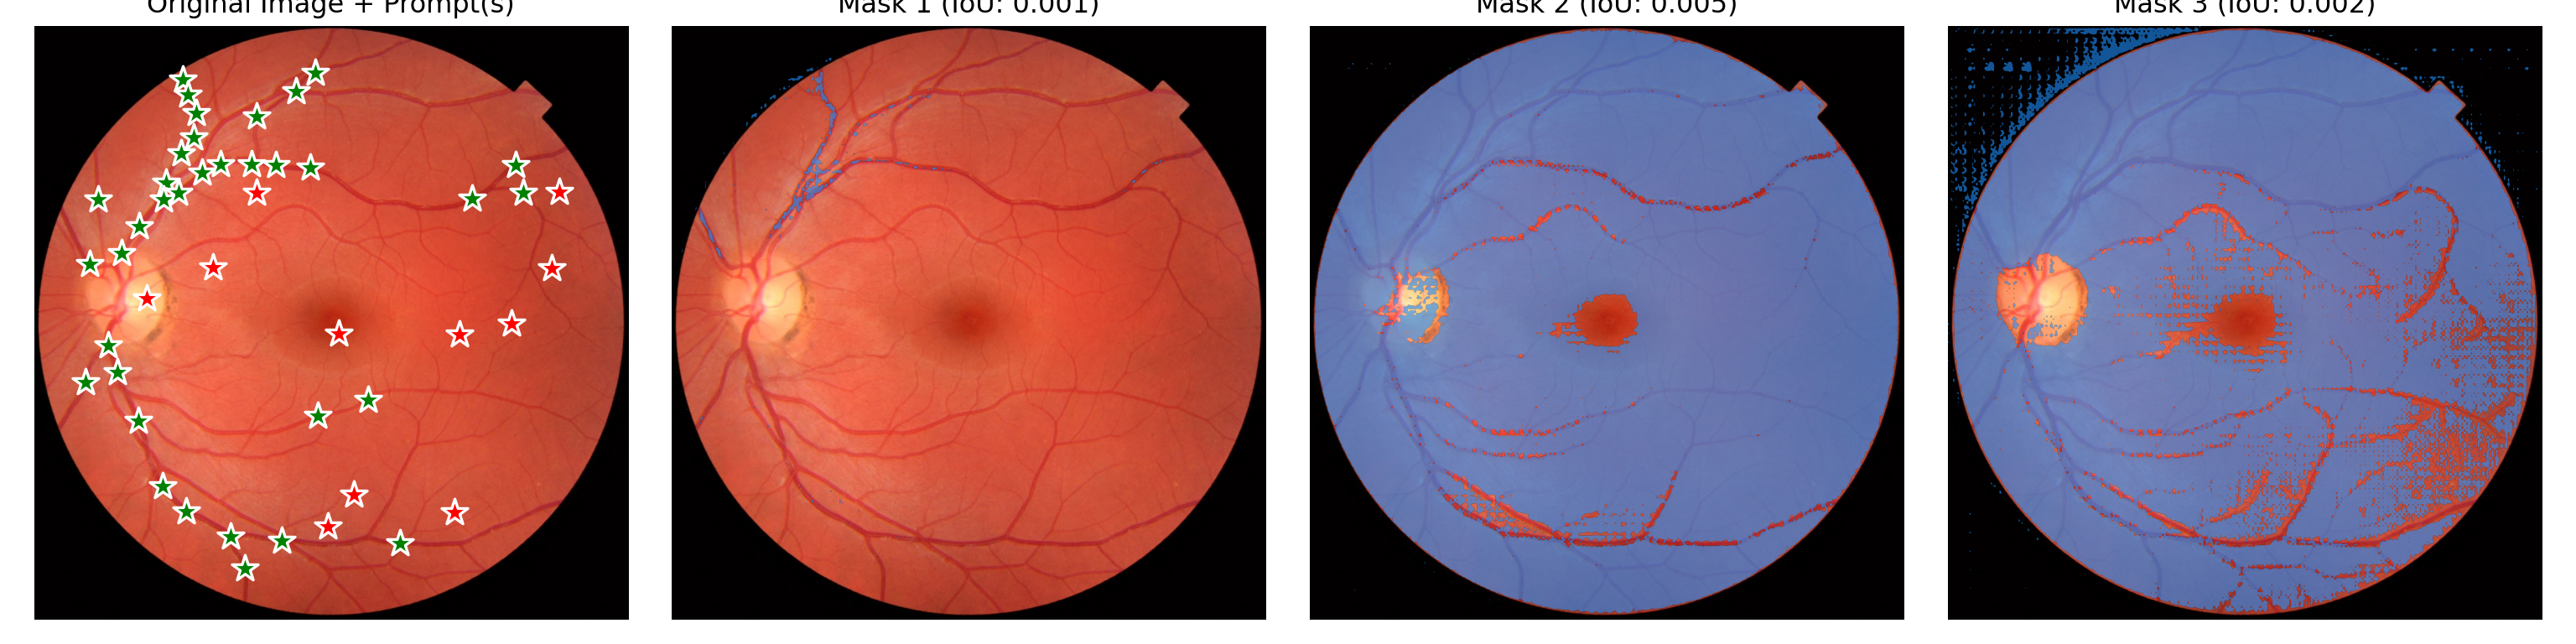
Generated 3 masks with shape torch.Size([1, 3, 1411, 1411])
plt.show()
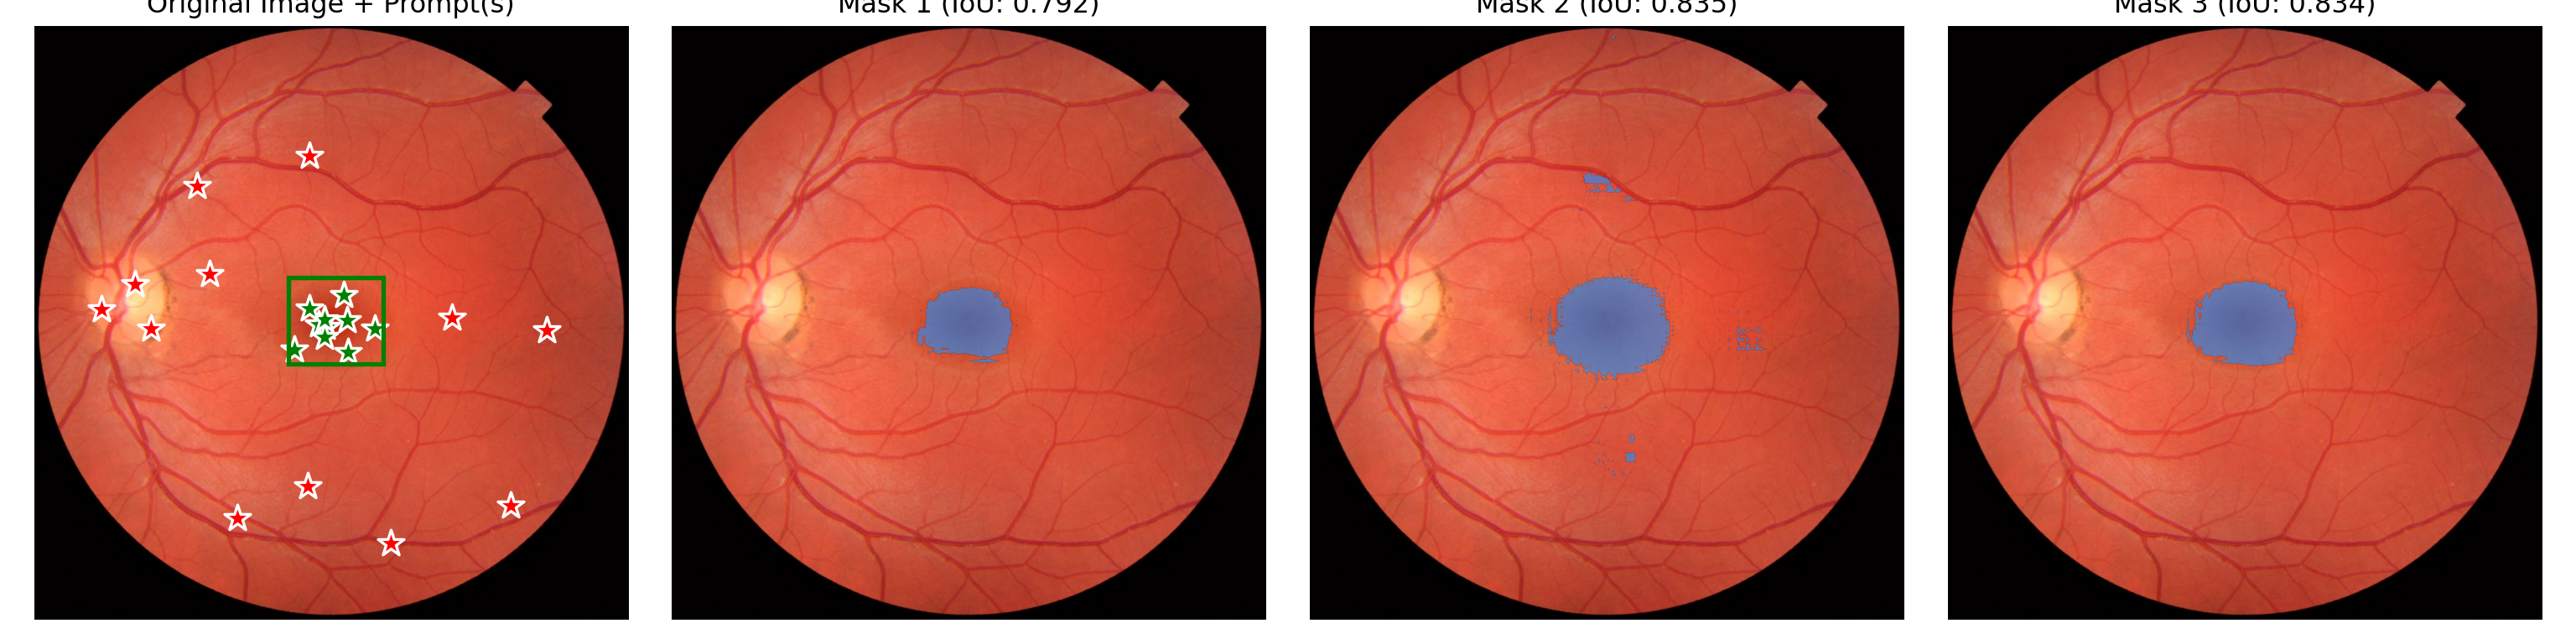
18.1 Trying to up the contrast a bit
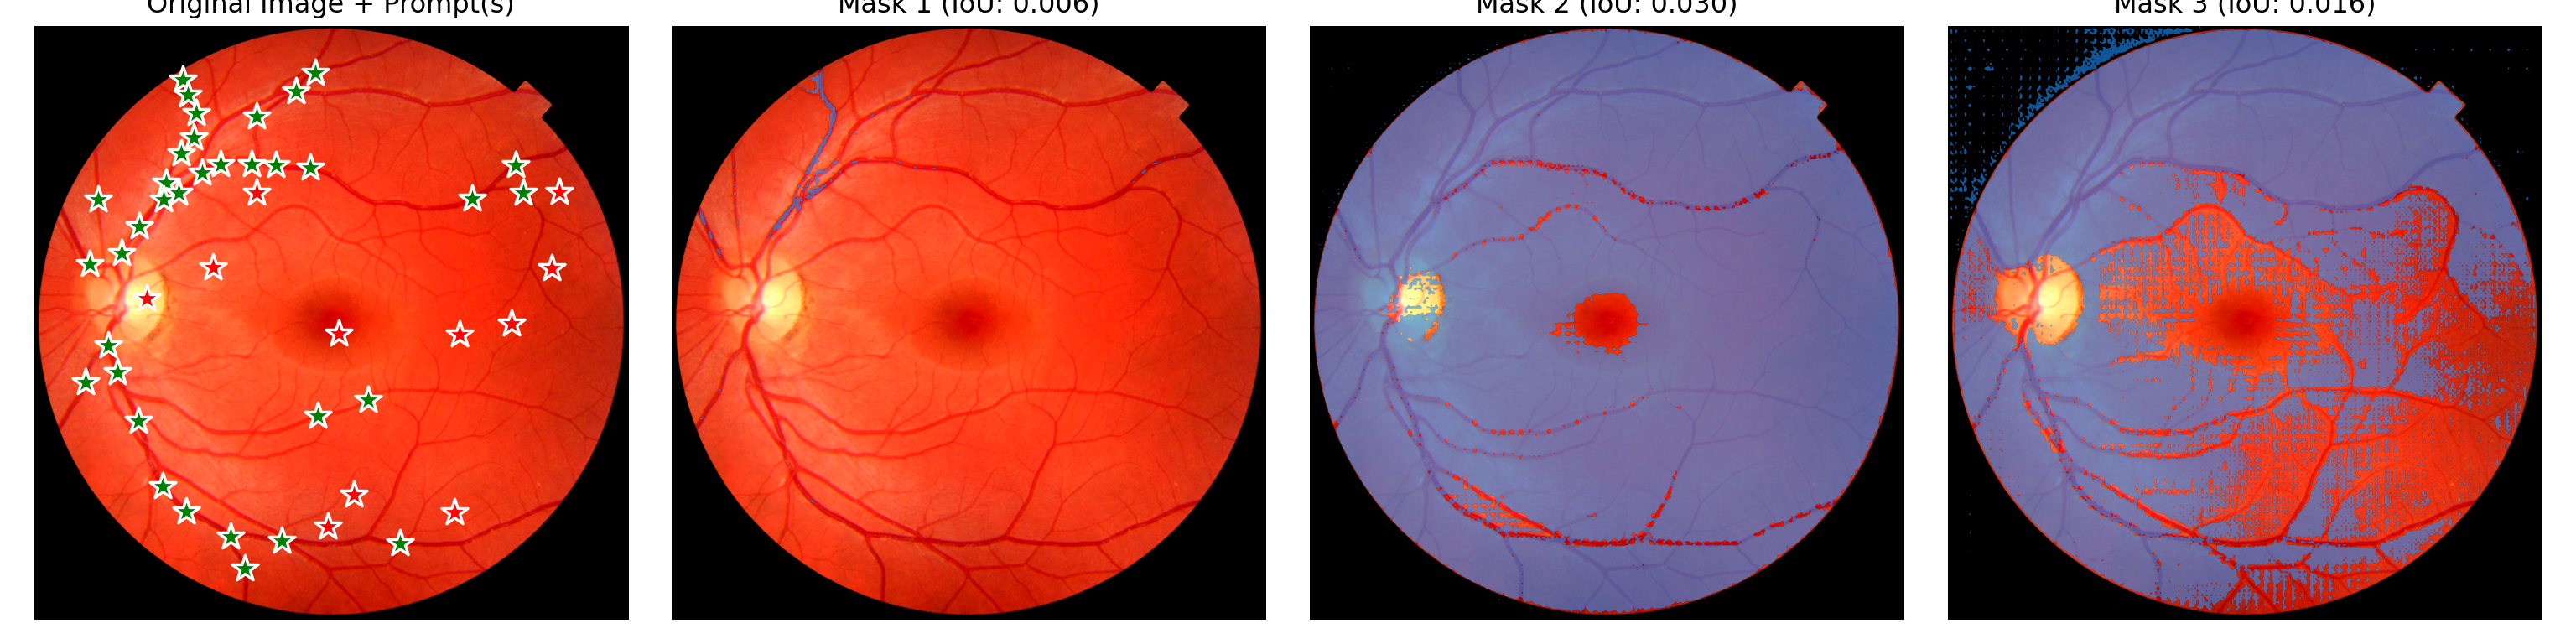
Nope, doesn’t help. A bit disappointing though not surprising as I doubt there is much vessel segmentation on fundus imaging in the training data for this model. Perhaps next I will see if I can use a LoRA approach to tune the SAM2 model….after doing a little bit of Googling with “SAM2 LoRA” I know see this paper.
Generated 3 masks with shape torch.Size([1, 3, 1411, 1411])
plt.show()
19 Conclusion
I’d like to wrap this post so it doesn’t take me 2-75 weeks to finish. I’ve sort of got something that kind of does something. For my next try, I’ll take a gander at whether I can add a LoRA model into this workflow. Which will require hand labelling my own images next so I can build a train/test dataset.