Introduction
Heatmaps are a core competency for a bioinformatician. They are a compact way to visually demonstrate relationships and changes in values across conditions.
We are going to use RNA-seq data to make two kinds of common heatmaps:
- Sample - Sample relationships
- Gene expression changes across samples for a subset of genes
Data processing
The two Rdata datasets we are going to use can be found here:
Load data
load('~/git/Let_us_plot/006_heatmaps/expression.Rdata')
load('~/git/Let_us_plot/006_heatmaps/metadata.Rdata')
Peek at expression
Rows are genes, columns are samples. Notice how the numeric sample names got X appended to the beginning. This is because R variable names cannot start with a number. Generally R will ‘fix’ your sample names during a base R handling.
head(expression)## Gene X10 X11 X16 X17 X18 X2
## 1 ABCA1 13.973778 12.244265 12.628729 13.182851 11.383009 12.333361
## 2 ABCA10 10.883834 8.813957 11.247787 9.870685 8.059123 9.346461
## 3 ABCA13 9.171412 7.629223 7.490137 8.134116 8.261363 6.430140
## 4 ABCA2 11.338420 14.976849 13.679589 12.014997 16.011478 13.439011
## 5 ABCA4 8.773803 11.641017 11.293125 8.072241 12.393982 10.126994
## 6 ABCA6 9.420007 6.285309 7.527962 8.659904 5.957441 6.535751
## X3 X4 X9 var
## 1 13.483913 11.377315 10.976546 1.056482
## 2 11.245402 8.585732 9.479805 1.387638
## 3 9.955795 7.499681 7.084981 1.152503
## 4 12.259725 16.007328 15.390794 3.168466
## 5 10.126629 11.505725 11.344527 2.040986
## 6 9.950779 5.658777 6.439992 2.526444# check number of rows (genes) and column (samples)
dim(expression)## [1] 2191 11Peek at metadata
Sample names with the serum conditions (Human Serum or Heat Inactivated HS) as well as the time the cells spend in the serum
metadata## sample serum treatment_hours
## 1 2 HS 24
## 2 3 HS 48
## 3 4 HIHS 48
## 4 9 HS 24
## 5 10 HS 48
## 6 11 HIHS 48
## 7 16 HS 24
## 8 17 HS 48
## 9 18 HIHS 48Brief outline on how the RNA-seq data was processed before we see it
- Salmon
- tximport
- DESeq2
- variance stabilizing transformation
- Filter genes to only retain high variance genes (often not necessary, but used to reduce the amount of data I share)
Load libraries
I’ve rapidly become a fan of ComplexHeatmap. It is capaable of creating just about anything and has excellent documentation and examples.
library(tidyverse)## ── Attaching packages ────────────────────────────────────────────────────────────────────────────────────────────────────────────────────────────────────────────── tidyverse 1.2.1 ──## ✔ ggplot2 3.0.0 ✔ purrr 0.2.4
## ✔ tibble 1.4.2 ✔ dplyr 0.7.6
## ✔ tidyr 0.8.1 ✔ stringr 1.3.1
## ✔ readr 1.1.1 ✔ forcats 0.3.0## ── Conflicts ───────────────────────────────────────────────────────────────────────────────────────────────────────────────────────────────────────────────── tidyverse_conflicts() ──
## ✖ dplyr::filter() masks stats::filter()
## ✖ dplyr::lag() masks stats::lag()library(ComplexHeatmap)## Loading required package: grid## ========================================
## ComplexHeatmap version 1.18.0
## Bioconductor page: http://bioconductor.org/packages/ComplexHeatmap/
## Github page: https://github.com/jokergoo/ComplexHeatmap
## Documentation: http://bioconductor.org/packages/ComplexHeatmap/
##
## If you use it in published research, please cite:
## Gu, Z. Complex heatmaps reveal patterns and correlations in multidimensional
## genomic data. Bioinformatics 2016.
## ========================================library(viridis)## Loading required package: viridisLiteCreate a Sample - Sample distance heatmap
An powerful way to see sample to sample relationships is to use the expression data to arrange the samples. The distance between each sample can be calculated by taking the euclidean distance between each sample. This reduces the space from a n x m matrix of values to a single number for each sample pair.
expression_dists <- expression %>%
  # drop the Gene and variance column
  select(-Gene, -var) %>%
  # flip axes as the dist() function does all of row-row relationships
  # we want samples as the rows....
  t() %>%
  # this actually calculates the euclidean distance (other types of distance are possible - read the docs with ?dist)
  dist() %>%
  # coerce to matrix, then data frame
  as.matrix() %>% data.frame()

# now a 9 x 9 data frame
expression_dists %>% dim()
## [1] 9 9Easy heatmap with ComplexHeatmap
I have a few problems with this plot:
- Red / blue is more for distinguishing over / under in my opinion - we are talking about close to far
- Don’t really need to see key for the colors. Distance is unit-less.
- We can’t map between sample name and the metadata
Heatmap(expression_dists)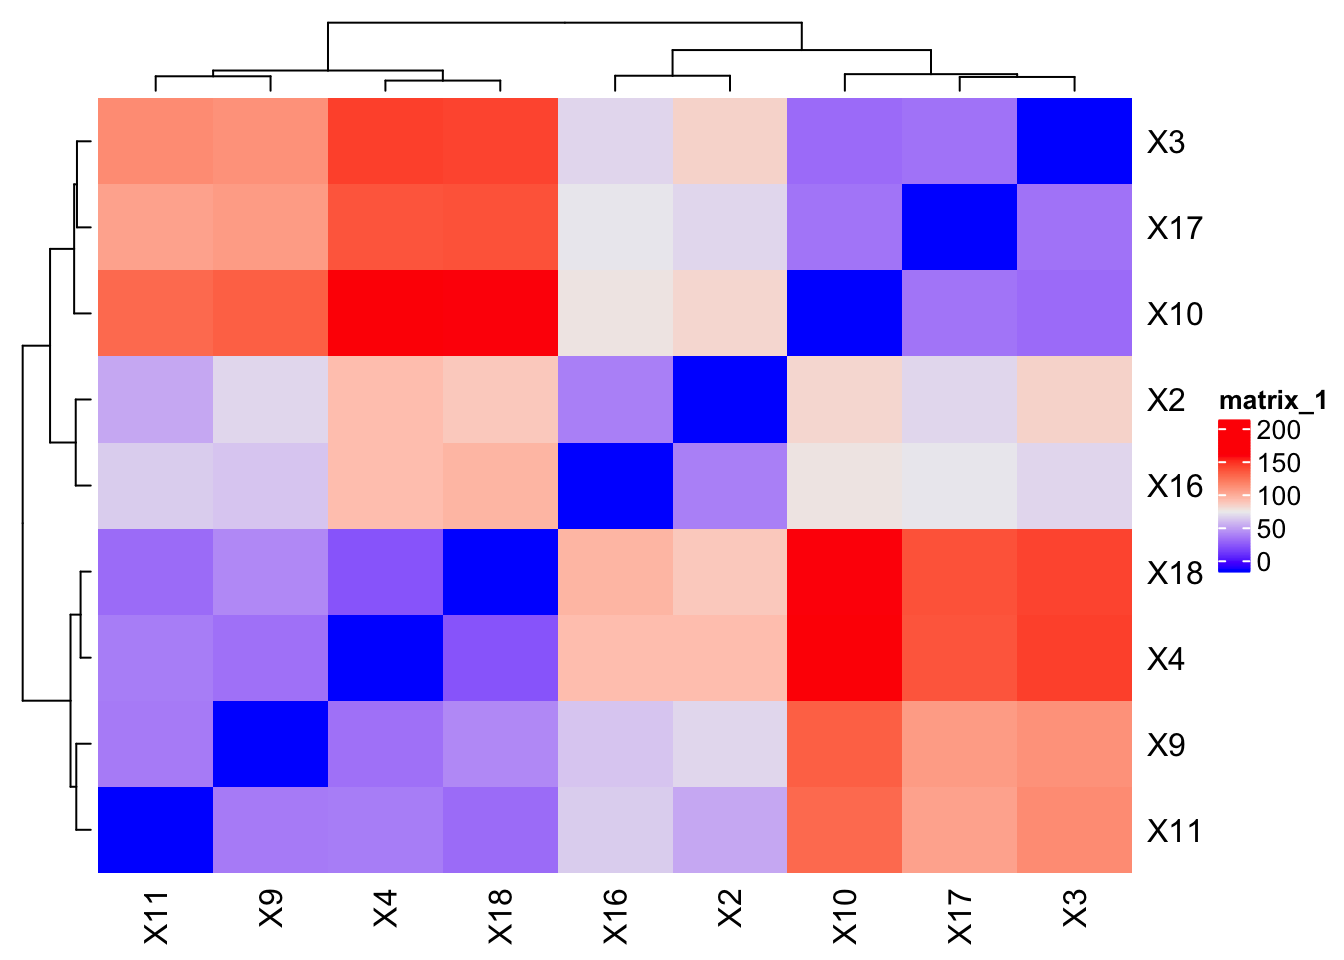
Complex heatmap
The metadata needs some extensive reworking to make it work with the sample distance data for the heatmap
mutatethe sample to add the ‘X’ to match the dist data column namesfilterto only keep metadata samples that are in the distance data (very common to have metadata for all samples)selectto grab the relevant columns (also common to have many extra columns that aren’t used)mutateagain to coerce the sample order in the metadata to match the sample order in the distance dataarrangeto use the order set above for the metadata (try erasing this and see what happens….)uniqueto remove duplicated rows
After that the HeatmapAnnotation take the Time and Serum as a data.frame and I am manually setting the colors by grabbing colors from the magma scheme from viridis.
metadata_heatmap <- metadata  %>%
  mutate(sample = paste0('X', sample)) %>%
  filter(sample %in% colnames(expression_dists)) %>%
  dplyr::select(sample, treatment_hours, serum) %>%
  mutate(sample=factor(sample, levels=colnames(expression_dists))) %>%
  arrange(sample) %>%
  unique()

ha_column = HeatmapAnnotation(df = data.frame(Time = metadata_heatmap$treatment_hours,
                                              Serum = metadata_heatmap$serum),
                              col = list(Serum = c("HS" =  magma(20)[5], "HIHS" = magma(20)[7]),
                                         Time = c("24" = magma(20)[12], "48" = magma(20)[18])))


Heatmap(expression_dists,
        col=viridis(100),
        name = 'Sample\nDistances',
        top_annotation = ha_column)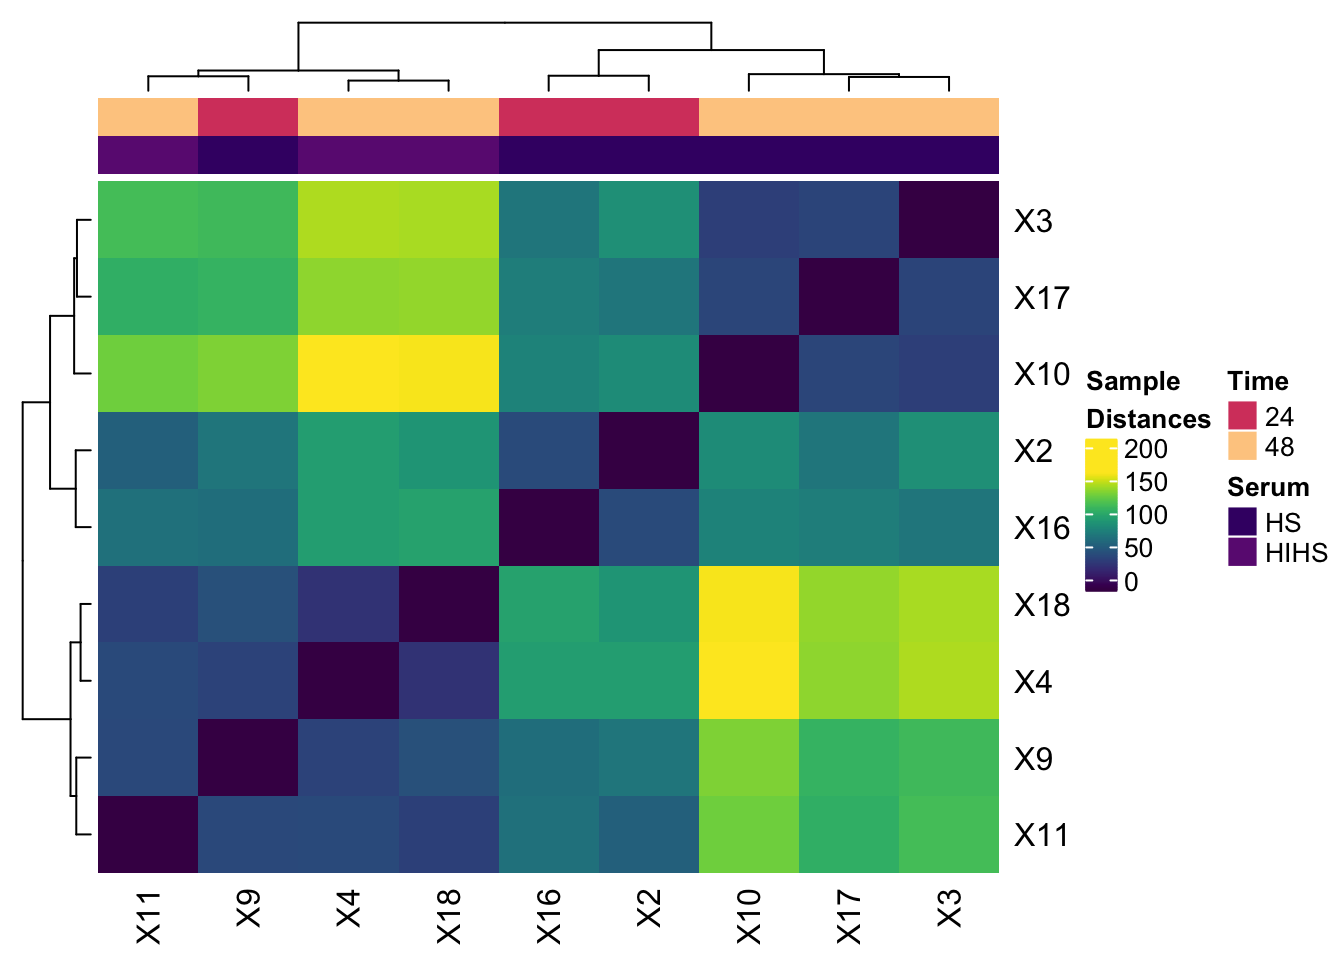
Finished heatmap
Now I am going to drop the ‘X’ from the sample names and remove the Sample Distances key
# substitute '' (nothing) for 'X' for the column and row names
colnames(expression_dists) <- gsub('X','',colnames(expression_dists))
rownames(expression_dists) <- gsub('X','',rownames(expression_dists))
Heatmap(expression_dists,
        col=viridis(100),
        show_heatmap_legend = F,
        top_annotation = ha_column)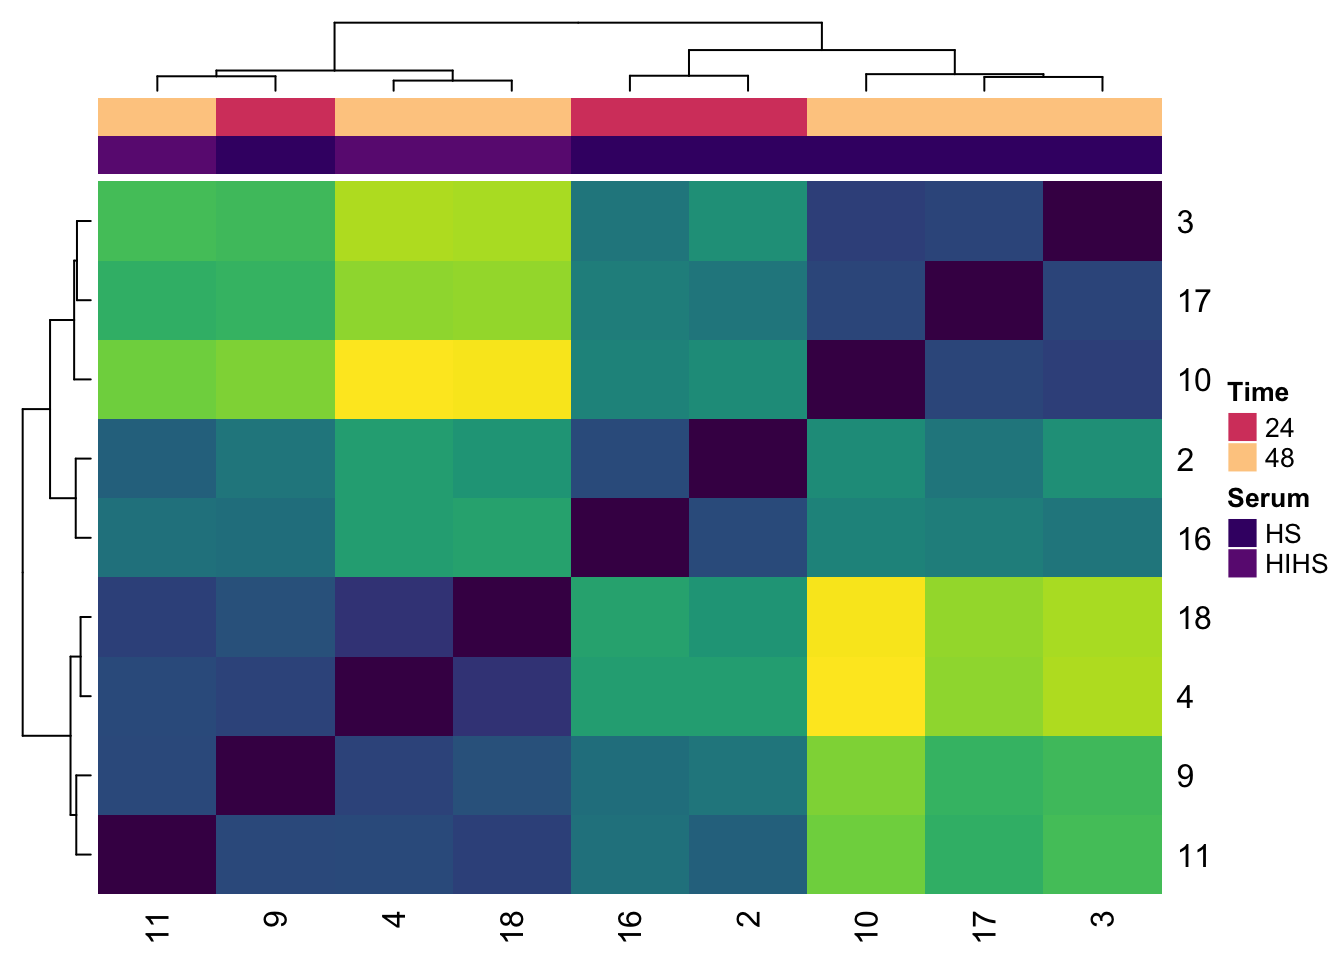
Gene Heatmaps
The next common type of heatmap is to show how a set of genes changes expression between conditions
We will look at a small set of genes and see how their expression changes when put in Heat Inactivated Human Serum (HIHS) or Human Serum (HS), only at the 48 hour time point.
First, make gene_set, HS, and HIHS sample vectors
gene_set <- c('EP300','ABCA4','CLCN6','CRX','HIST1H1T','IGSF9','SLC16A7','MYO5C','NEURL3')

HS_samples <- metadata %>% filter(serum=='HS', treatment_hours==48) %>% pull(sample) %>% unique() %>% paste0('X',.)
HIHS_samples <- metadata %>% filter(serum=='HIHS', treatment_hours==48) %>% pull(sample) %>% unique() %>% paste0('X',.)
Now calculate the change in expression across the HIHS <-> HS comparison and prep the metadata
gene_set = expression %>% filter(Gene %in% gene_set) %>% select(-var)

# HIHS is the 'reference'
# we'll look at how expression changes with you use HS
row_mean_HIHS = gene_set[,HIHS_samples] %>% rowMeans()

# now subtract the mean HIHS expression from each row,
# and only keep HS samples for the plot
heatmap_expression = gene_set[,HS_samples] - row_mean_HIHS
# add Gene back as rownames
row.names(heatmap_expression) <- gene_set$Gene
# prep metadata as above
metadata_heatmap <- metadata  %>%
  mutate(sample = paste0('X', sample)) %>%
  filter(sample %in% colnames(heatmap_expression)) %>%
  dplyr::select(sample, treatment_hours, serum) %>%
  mutate(sample=factor(sample, levels=colnames(heatmap_expression))) %>%
  arrange(sample) %>%
  unique()
The clustering of the rows is really useful to quickly see what sets of genes are moving in the same direction
ha_column = HeatmapAnnotation(df = data.frame(Time = metadata_heatmap$treatment_hours,
                                              Serum = metadata_heatmap$serum),
                              col = list(Serum = c("HS" =  magma(20)[5], "HIHS" = magma(20)[7]),
                                         Time = c("24" = magma(20)[12], "48" = magma(20)[18])))

# Drop the X in sample names
colnames(heatmap_expression) <- gsub('X','',colnames(heatmap_expression))
Heatmap(heatmap_expression,
        cluster_columns = FALSE,
        name = 'log2(Fold\nChange)',
        top_annotation = ha_column)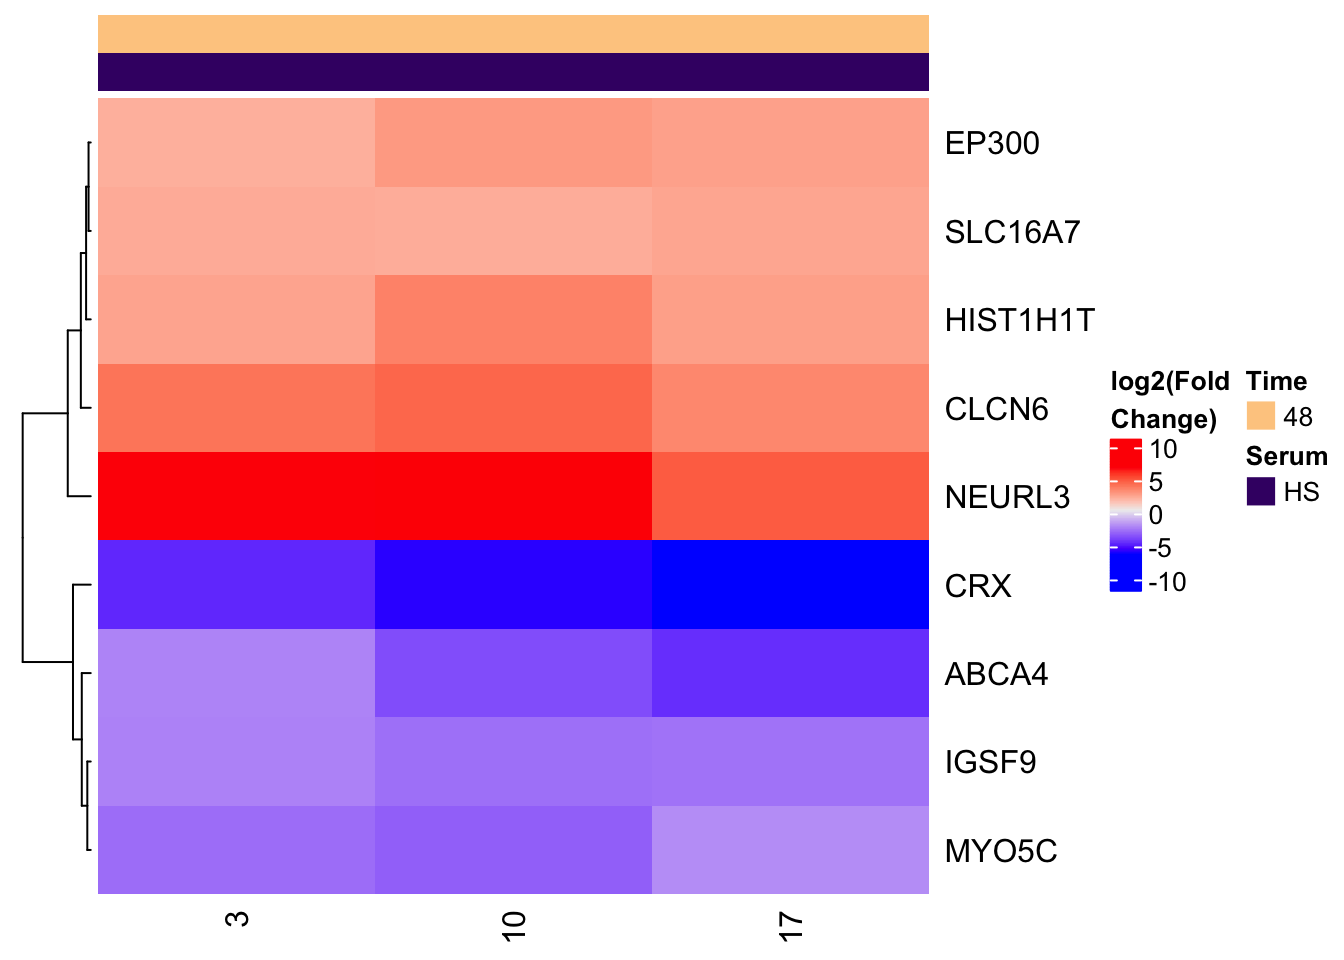
A bit simpler
You may think the annotations are superfluous, as they are all the same. If you are making just one, I would agree. Usually I am making a bunch of plots and I’d rather keep the annotations attached so I don’t get confused later.
It is easy enough to drop them.
Heatmap(heatmap_expression,
        cluster_columns = FALSE,
        name = 'log2(Fold\nChange)')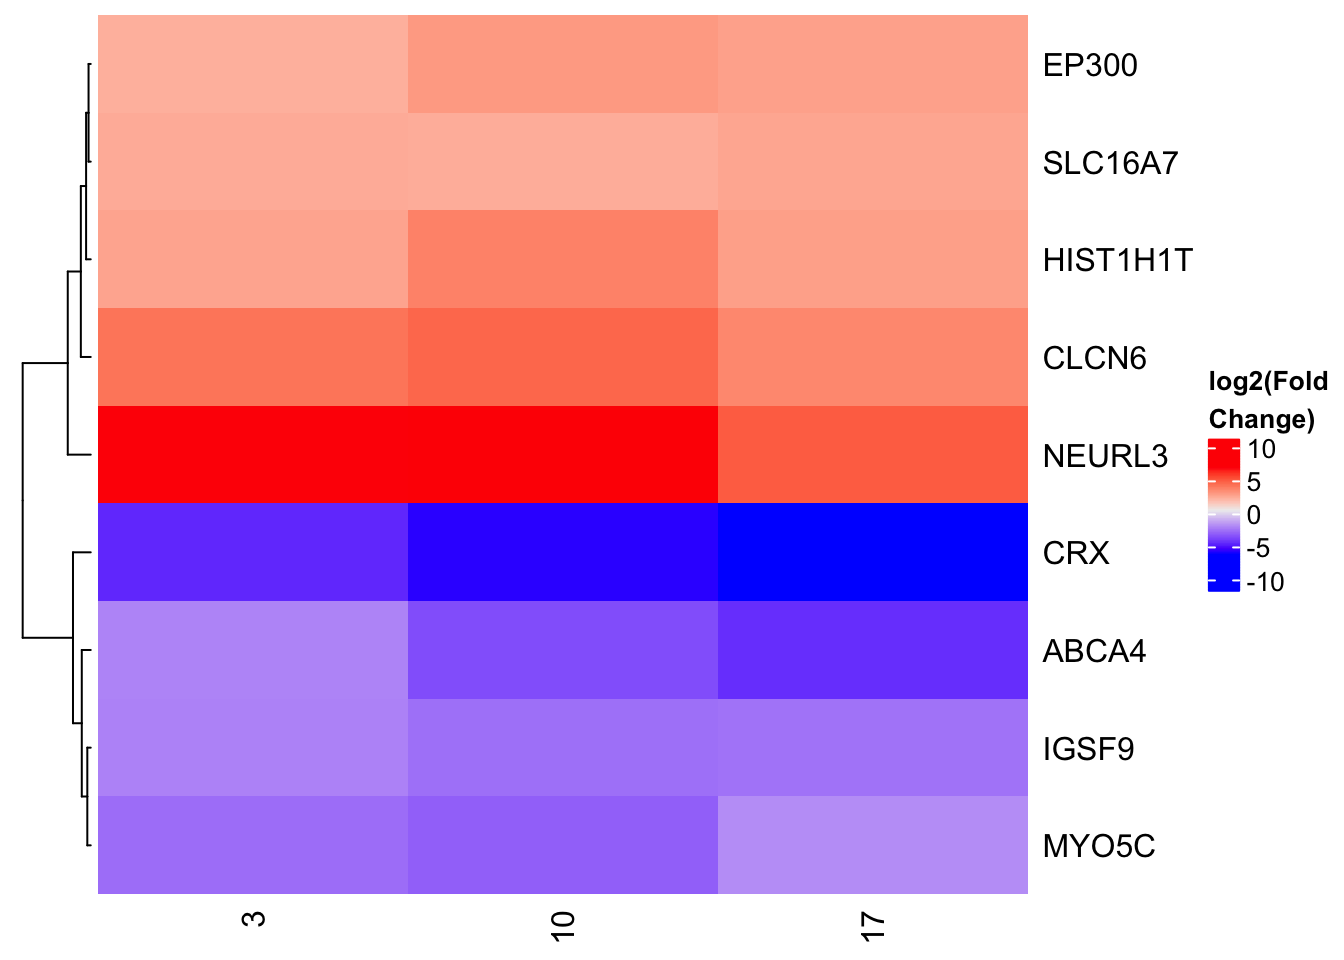
Session Info
devtools::session_info()## Session info -------------------------------------------------------------## setting value
## version R version 3.5.0 (2018-04-23)
## system x86_64, darwin15.6.0
## ui X11
## language (EN)
## collate en_US.UTF-8
## tz America/New_York
## date 2018-07-16## Packages -----------------------------------------------------------------## package * version date source
## assertthat 0.2.0 2017-04-11 CRAN (R 3.5.0)
## backports 1.1.2 2017-12-13 CRAN (R 3.5.0)
## base * 3.5.0 2018-04-24 local
## bindr 0.1.1 2018-03-13 CRAN (R 3.5.0)
## bindrcpp * 0.2.2 2018-03-29 CRAN (R 3.5.0)
## blogdown 0.8.1 2018-07-16 Github (rstudio/blogdown@d54c39a)
## bookdown 0.7 2018-02-18 CRAN (R 3.5.0)
## broom 0.4.4 2018-03-29 CRAN (R 3.5.0)
## cellranger 1.1.0 2016-07-27 CRAN (R 3.5.0)
## circlize 0.4.3 2017-12-20 CRAN (R 3.5.0)
## cli 1.0.0 2017-11-05 CRAN (R 3.5.0)
## colorspace 1.3-2 2016-12-14 CRAN (R 3.5.0)
## compiler 3.5.0 2018-04-24 local
## ComplexHeatmap * 1.18.0 2017-10-25 Bioconductor (R 3.5.0)
## crayon 1.3.4 2017-09-16 CRAN (R 3.5.0)
## datasets * 3.5.0 2018-04-24 local
## devtools 1.13.5 2018-02-18 CRAN (R 3.5.0)
## digest 0.6.15 2018-01-28 CRAN (R 3.5.0)
## dplyr * 0.7.6 2018-06-29 cran (@0.7.6)
## evaluate 0.10.1 2017-06-24 CRAN (R 3.5.0)
## forcats * 0.3.0 2018-02-19 CRAN (R 3.5.0)
## foreign 0.8-70 2017-11-28 CRAN (R 3.5.0)
## GetoptLong 0.1.6 2017-03-07 CRAN (R 3.5.0)
## ggplot2 * 3.0.0 2018-07-03 cran (@3.0.0)
## GlobalOptions 0.0.13 2018-03-15 CRAN (R 3.5.0)
## glue 1.2.0 2017-10-29 CRAN (R 3.5.0)
## graphics * 3.5.0 2018-04-24 local
## grDevices * 3.5.0 2018-04-24 local
## grid * 3.5.0 2018-04-24 local
## gridExtra 2.3 2017-09-09 CRAN (R 3.5.0)
## gtable 0.2.0 2016-02-26 CRAN (R 3.5.0)
## haven 1.1.1 2018-01-18 CRAN (R 3.5.0)
## hms 0.4.2 2018-03-10 CRAN (R 3.5.0)
## htmltools 0.3.6 2017-04-28 CRAN (R 3.5.0)
## httr 1.3.1 2017-08-20 CRAN (R 3.5.0)
## jsonlite 1.5 2017-06-01 CRAN (R 3.5.0)
## knitr 1.20 2018-02-20 CRAN (R 3.5.0)
## lattice 0.20-35 2017-03-25 CRAN (R 3.5.0)
## lazyeval 0.2.1 2017-10-29 CRAN (R 3.5.0)
## lubridate 1.7.4 2018-04-11 CRAN (R 3.5.0)
## magrittr 1.5 2014-11-22 CRAN (R 3.5.0)
## memoise 1.1.0 2017-04-21 CRAN (R 3.5.0)
## methods * 3.5.0 2018-04-24 local
## mnormt 1.5-5 2016-10-15 CRAN (R 3.5.0)
## modelr 0.1.2 2018-05-11 CRAN (R 3.5.0)
## munsell 0.4.3 2016-02-13 CRAN (R 3.5.0)
## nlme 3.1-137 2018-04-07 CRAN (R 3.5.0)
## parallel 3.5.0 2018-04-24 local
## pillar 1.2.3 2018-05-25 CRAN (R 3.5.0)
## pkgconfig 2.0.1 2017-03-21 CRAN (R 3.5.0)
## plyr 1.8.4 2016-06-08 CRAN (R 3.5.0)
## psych 1.8.4 2018-05-06 CRAN (R 3.5.0)
## purrr * 0.2.4 2017-10-18 CRAN (R 3.5.0)
## R6 2.2.2 2017-06-17 CRAN (R 3.5.0)
## RColorBrewer 1.1-2 2014-12-07 CRAN (R 3.5.0)
## Rcpp 0.12.17 2018-05-18 CRAN (R 3.5.0)
## readr * 1.1.1 2017-05-16 CRAN (R 3.5.0)
## readxl 1.1.0 2018-04-20 CRAN (R 3.5.0)
## reshape2 1.4.3 2017-12-11 CRAN (R 3.5.0)
## rjson 0.2.19 2018-05-18 CRAN (R 3.5.0)
## rlang 0.2.1 2018-05-30 CRAN (R 3.5.0)
## rmarkdown 1.10 2018-06-11 cran (@1.10)
## rprojroot 1.3-2 2018-01-03 CRAN (R 3.5.0)
## rstudioapi 0.7 2017-09-07 CRAN (R 3.5.0)
## rvest 0.3.2 2016-06-17 CRAN (R 3.5.0)
## scales 0.5.0 2017-08-24 CRAN (R 3.5.0)
## shape 1.4.4 2018-02-07 CRAN (R 3.5.0)
## stats * 3.5.0 2018-04-24 local
## stringi 1.2.2 2018-05-02 CRAN (R 3.5.0)
## stringr * 1.3.1 2018-05-10 CRAN (R 3.5.0)
## tibble * 1.4.2 2018-01-22 CRAN (R 3.5.0)
## tidyr * 0.8.1 2018-05-18 CRAN (R 3.5.0)
## tidyselect 0.2.4 2018-02-26 CRAN (R 3.5.0)
## tidyverse * 1.2.1 2017-11-14 CRAN (R 3.5.0)
## tools 3.5.0 2018-04-24 local
## utils * 3.5.0 2018-04-24 local
## viridis * 0.5.1 2018-03-29 CRAN (R 3.5.0)
## viridisLite * 0.3.0 2018-02-01 CRAN (R 3.5.0)
## withr 2.1.2 2018-03-15 CRAN (R 3.5.0)
## xfun 0.3 2018-07-06 cran (@0.3)
## xml2 1.2.0 2018-01-24 CRAN (R 3.5.0)
## yaml 2.1.19 2018-05-01 CRAN (R 3.5.0)