Load packages, pull data
2020 03 30 Update
CSSE changed their data structure, so I’ve updated the document.
I was using their “time series” data, but they dropped the US-specific (with state by state info) documents.
So we’ll have change the import process to use their “daily reports”
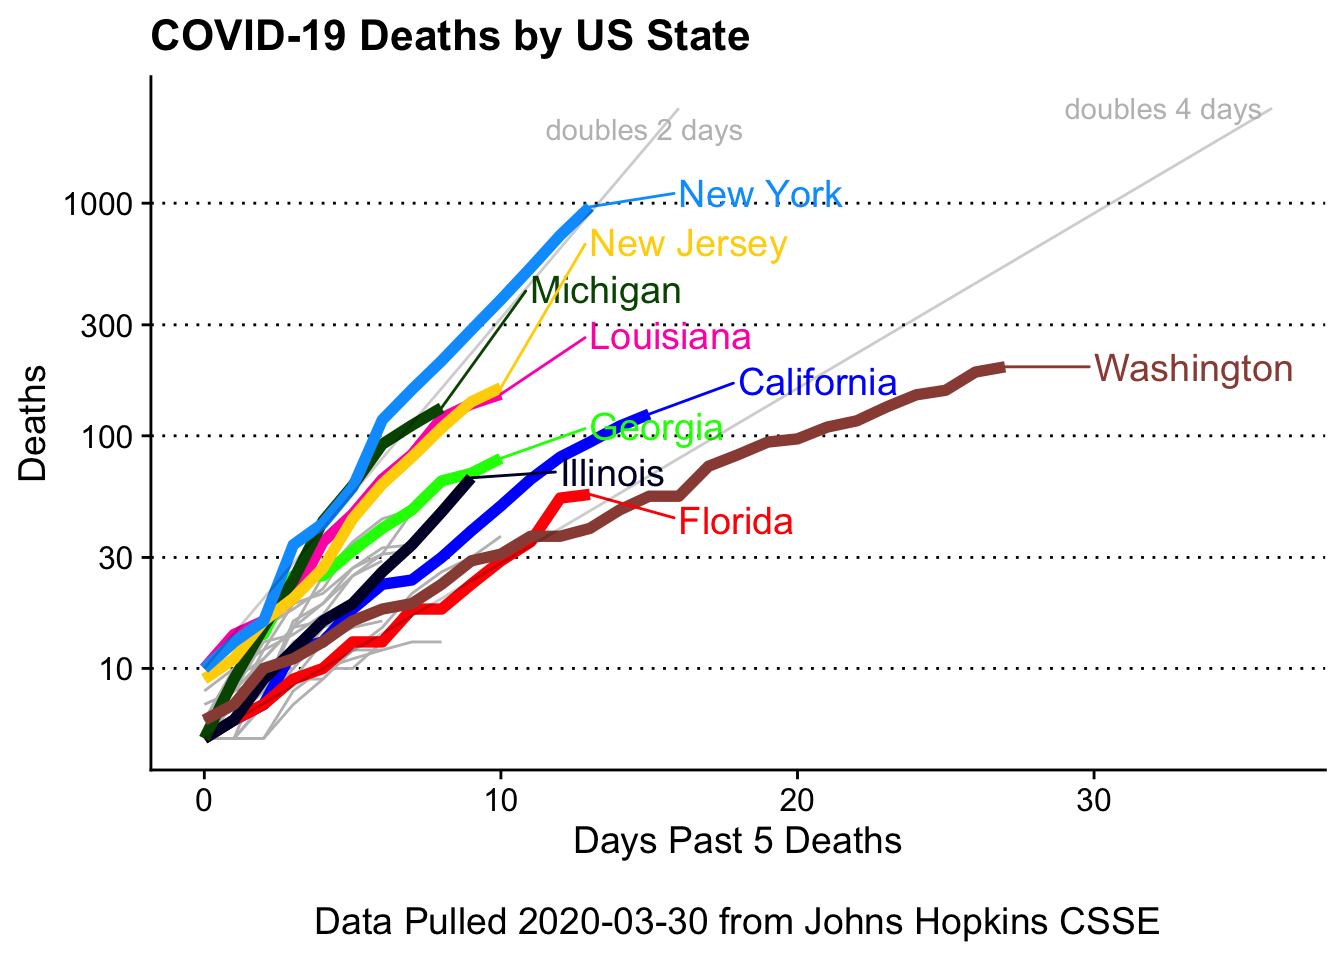
I’ve added one more plot - the deaths by state with overlays showing the future projections if deaths double every 2 or 4 days.
library(tidyverse)
library(gganimate)
library(ggrepel)
library(pals)
library(purrr)

start = as.Date('2020-01-22')
end = as.Date('2020-03-29')
files = paste0('https://github.com/CSSEGISandData/COVID-19/raw/master/csse_covid_19_data/csse_covid_19_daily_reports/', format(seq(start,end, by = 1), format = '%m-%d-%Y'), '.csv')

names(files) <- format(seq(start,end, by = 1))

# use purrr to read_csv each individual file and make a list of data frames
covid_data_list <- files %>%
  map(read_csv)

# loop through each data frame and clean column names
# add date to each individual data frame
# only keep state, country, confirmed, deaths, recovered
for (set in names(covid_data_list)){
  colnames(covid_data_list[[set]]) <- gsub('/','_', colnames(covid_data_list[[set]]))
  covid_data_list[[set]] <- covid_data_list[[set]] %>%
    select(Province_State, Country_Region, Confirmed, Deaths, Recovered) %>%
    mutate(Date = as.Date(set))
}

# collapse list of data frames to one data frame
covid_data <- covid_data_list %>%
  bind_rows()

# make state_table to convert two letter states (eg IA) to full name (eg Iowa)
state_table <- cbind(state.abb, state.name) %>% as_tibble()
# make USA data and clean up state names and remove the cruise ship data (and a few "Wuhan Evacuee")
covid_usa <- covid_data %>%
  filter(Country_Region == 'US') %>%
  filter(!grepl('Diamond|Princess|Wuhan', Province_State)) %>%
  mutate(State = case_when(grepl(',', `Province_State`) ~ str_extract(`Province_State`, ', \\w\\w') %>%
                             gsub('\\.| |,','',.) %>%
                             toupper(),
                           TRUE ~ `Province_State`)) %>%
  left_join(., state_table, by = c('State' = 'state.abb')) %>%
  # swap in full name into State column
  mutate(State = case_when(is.na(state.name) ~ State,
                           TRUE ~ state.name)) %>%
  # fix a few more inconsistent state / region names
  mutate(State = case_when(State == 'DC' ~ 'District of Columbia',
                           State == 'United States Virgin Islands' ~ 'Virgin Islands',
                           State == 'Chicago' ~ 'Illinois',
                           TRUE ~ State)) %>%
  filter(!State %in% c('US','Recovered')) %>%
  group_by(State, Date) %>%
  # now summarise "redundant" state entries into
  summarise(Cases = sum(Confirmed),
            Deaths = sum(Deaths),
            Recovered = sum(Recovered))
Plotter function
This is a fairly complex function as it:
- overlays color lines by
top_states, given by user, on top of all data (in gray) - labels the color lines with
ggrepel(but only at the end!) - uses a
cowplottheme, with tweaked grid lines - custom x and y labels
- expand x lim to fit the state names
covid19_plotter <- function(clean_data,
                            type = Cases,
                            top_states = c('Washington', 'New York', 'California'),
                            xlab = '',
                            ylab = '',
                            title = ''){
  plot <- clean_data %>%
    filter(State %in% top_states) %>%
    ggplot(aes(x=Date,y= {{ type }},
               group = State,
               color = State)) +
    geom_line(data = clean_data, aes(x=Date, y = {{ type }}, group = State), color = 'gray') +
    geom_line(size = 2) +
    ggrepel::geom_text_repel(data = clean_data %>%
                               filter(State %in% top_states) %>%
                               filter(Date == max(Date)),
                             aes(x=Date, y = {{ type }}, label = State),
                             direction = 'y',
                             nudge_x = 3,
                             hjust = 0,
                             segment.size = 0.5,
                             force = 2,
                             size = 5) +
    cowplot::theme_cowplot() +
    guides(color=FALSE) +
    scale_color_manual(values = as.vector(pals::glasbey(26))) +
    theme(panel.grid.major.y = element_line(linetype = 'dotted')) +
    scale_y_continuous(breaks = c(10, 100,1000,5000,10000, 20000, 60000)) +
    scale_x_date(date_labels = "%b %d",
                 breaks = c(as.Date('2020-02-01'),
                            as.Date('2020-02-15'),
                            as.Date('2020-03-01'),
                            as.Date('2020-03-15'),
                            max(clean_data$Date)
                 )) +
    expand_limits(x = c(min(clean_data$Date),max(clean_data$Date) + 7 )) +
    ylab(ylab) + xlab(xlab) + ggtitle(title)
  plot
}
Cases by state
Important: We don’t know the denominator (number of tests given). So New York may not have far more cases than the rest of the other states, but rather they are testing far more.
I’ve overwritten the function-specified y scale (hence the ggplot warning).
# find top n (by sum cases) states
top_n <- covid_usa %>% filter(Date == max(Date)) %>% arrange(-Cases) %>% head(9) %>% pull(State)

covid19_plotter(covid_usa,
                type = Cases,
                top_states = top_n,
                ylab = 'Cases',
                xlab = paste0('\nData Pulled ', Sys.Date(), ' from Johns Hopkins CSSE'),
                title = 'USA COVID-19 Cases by State') +
  scale_y_continuous(breaks = c(100,1000,5000,10000, 20000, 40000, 60000))
## Scale for 'y' is already present. Adding another scale for 'y', which will
## replace the existing scale.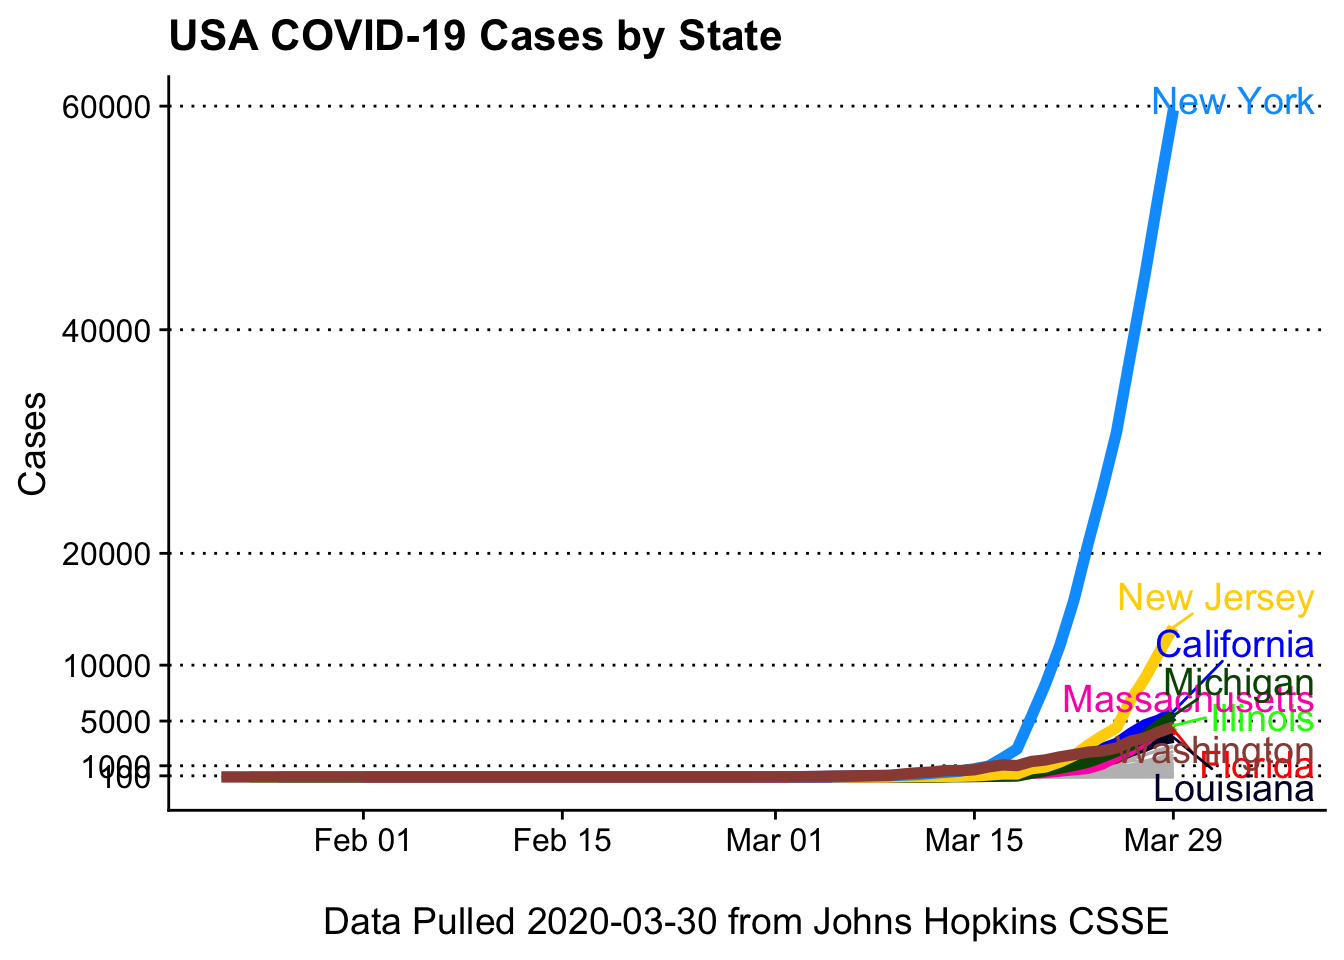
Cases, with log10 scaling
Log10 scaling helps see the trends between states better
covid19_plotter(covid_usa %>% filter(Cases > 0),
                type = Cases,
                top_states = top_n,
                ylab = 'log10 Cases',
                xlab = paste0('\nData Pulled ', Sys.Date(), ' from Johns Hopkins CSSE'),
                title = 'USA COVID-19 Cases by State') +
  coord_trans(y = 'log10')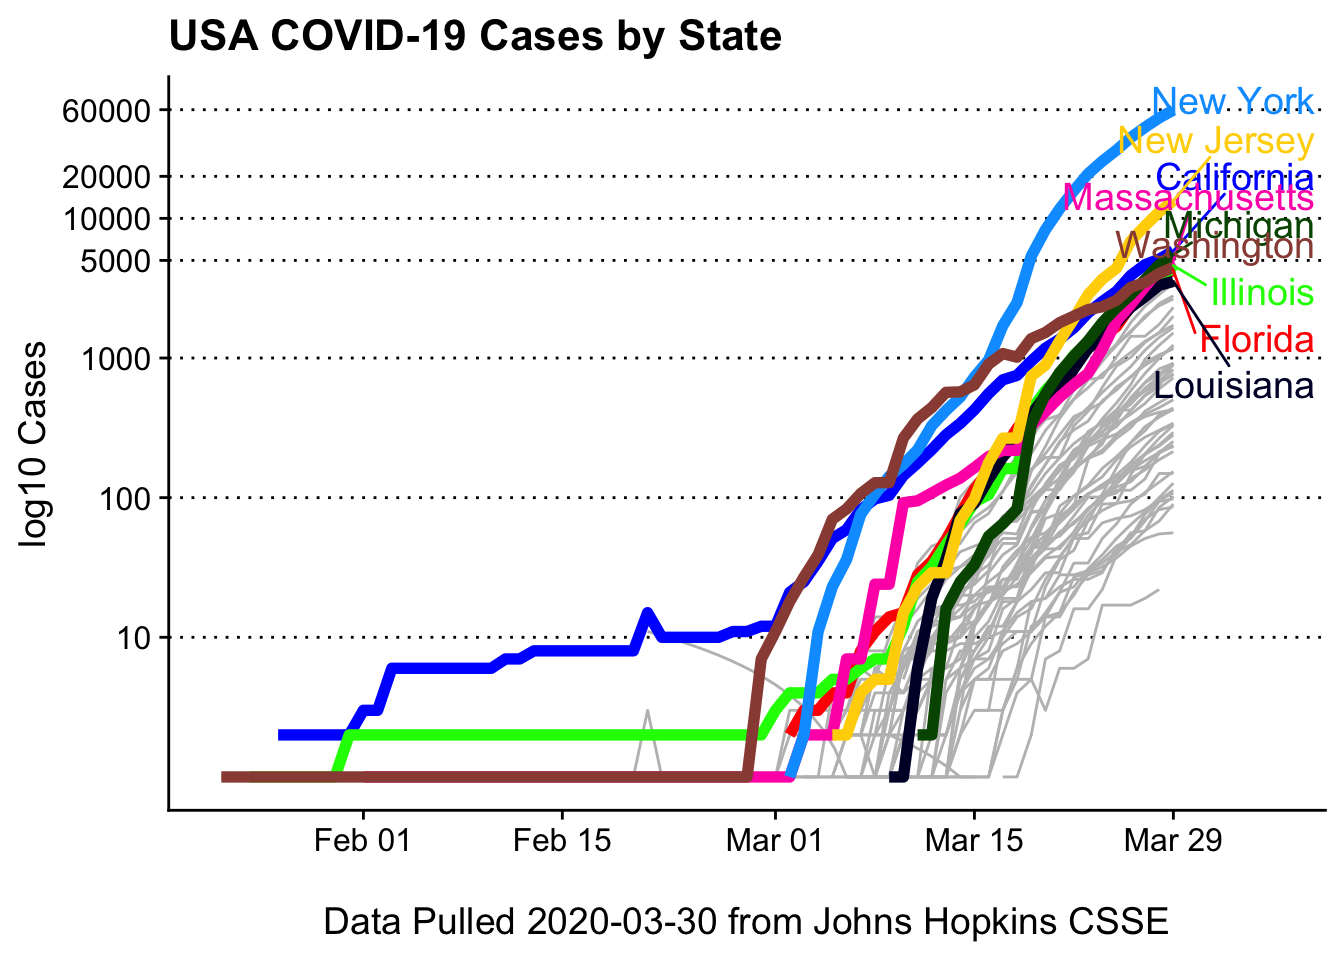
Deaths by state (log10 scaled)
Deaths may be a more useful metric as states may not be testing at comparable rates
# find top n (by sum cases) states
top_n <- covid_usa %>% filter(Date == max(Date)) %>% arrange(-Deaths) %>% head(9) %>% pull(State)
covid19_plotter(covid_usa %>% filter(Deaths > 0),
                type = Deaths,
                top_states = top_n,
                ylab = 'Deaths',
                xlab = paste0('\nData Pulled ', Sys.Date(), ' from Johns Hopkins CSSE'),
                title = 'COVID-19 Deaths by US State') +
  coord_trans(y = 'log10') +
  scale_y_continuous(breaks = c(10,25, 50, 100, 250, 500, 1000))
## Scale for 'y' is already present. Adding another scale for 'y', which will
## replace the existing scale.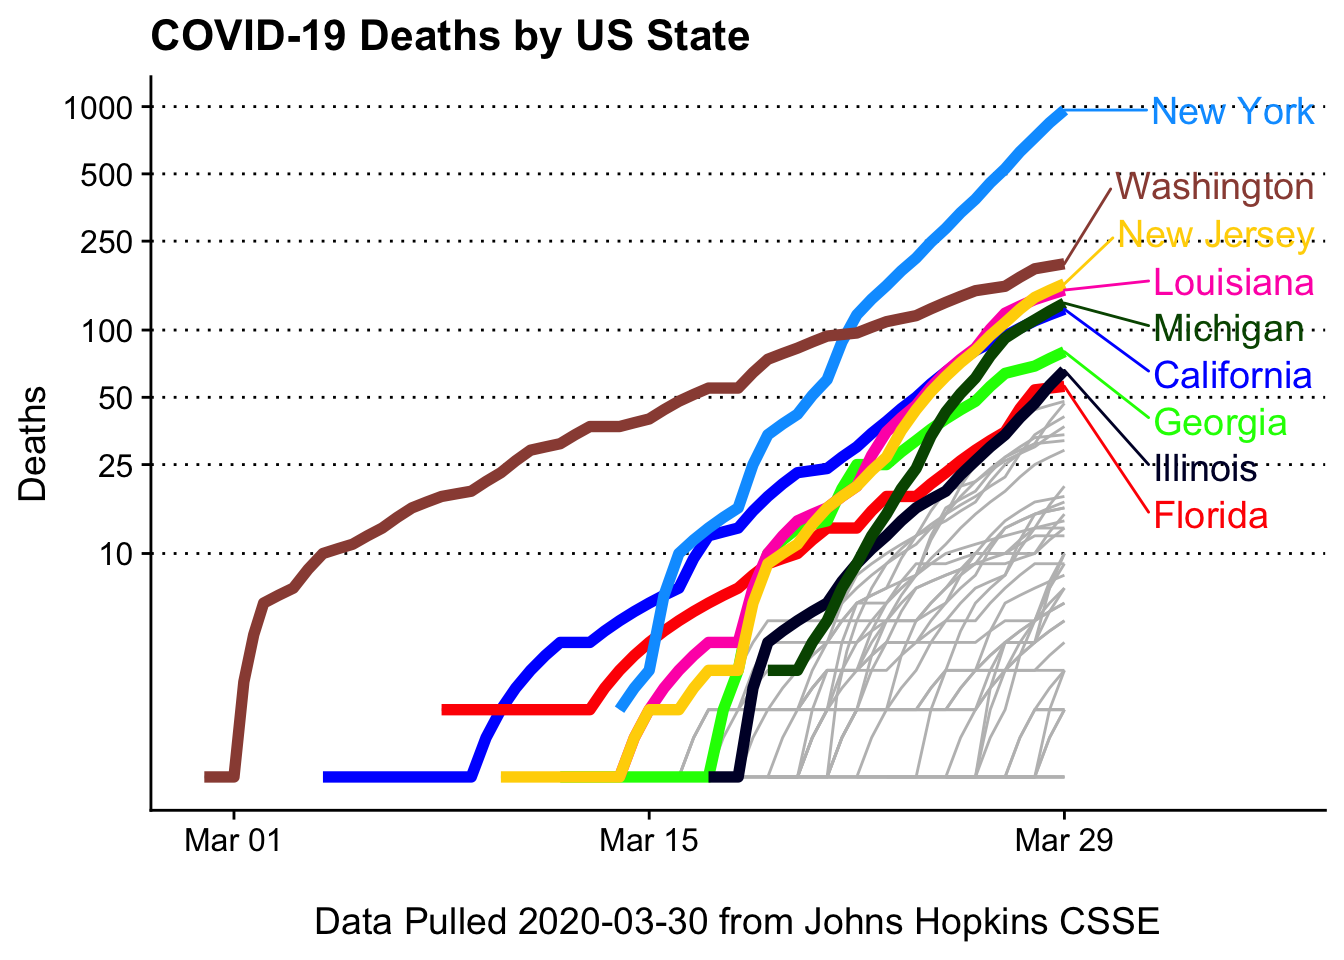
Deaths by state, animated
This is extremely easy to do, thanks to the gganimate package (written by Thomas Lin Pedersen)
animation <- covid19_plotter(covid_usa %>% filter(Deaths > 0),
                             type = Deaths,
                             top_states = top_n,
                             ylab = 'Deaths',
                             xlab = paste0('\nData Pulled ', Sys.Date(), ' from Johns Hopkins CSSE'),
                             title = 'COVID-19 Deaths by US State') +
  coord_trans(y = 'log10') +
  scale_y_continuous(breaks = c(5, 10,25, 50, 100, 250, 500, 1000)) +
  transition_reveal(Date) +
  view_follow(fixed_y = TRUE,
              fixed_x = TRUE)

animate(animation,
        height = 400,
        width = 600,
        end_pause = 30)
Shift plot
Many visualizations (e.g. NYTimes, Financial Times) are plotting (on the x-axis) Days Past n Deaths so you can better compare the infection rate across different locations.
Let’s give that a try.
We need to find, for each state, the first Date where Deaths >= 5.
We see the state of Washington was about two weeks ahead of anyone else
day0 <- covid_usa %>%
  filter(Deaths >= 5) %>%
  group_by(State) %>%
  summarise(Day0 = min(Date))
day0 %>% arrange(Day0)
## # A tibble: 37 x 2
## State Day0
## <chr> <date>
## 1 Washington 2020-03-02
## 2 California 2020-03-14
## 3 Florida 2020-03-16
## 4 New York 2020-03-16
## 5 Georgia 2020-03-19
## 6 Louisiana 2020-03-19
## 7 New Jersey 2020-03-19
## 8 Texas 2020-03-19
## 9 Illinois 2020-03-20
## 10 Michigan 2020-03-21
## # … with 27 more rowsTransform Data and plot
We filter the data to only retain States with >= 5 deaths
Then we left join the day0 table we made above
We do math (yes, R can do math on Dates), creating a new Date where Date = Date - Day0 (Day0 is first Date in state where COVID19 deaths >= 5).
As our new Date is a time, we swap out the x axis scale for scale_x_continuous
We see that New York, Michigan, Lousiana, and New Jersey are on similar trajectories.
covid19_plotter(covid_usa %>%
                  filter(State %in% day0$State,
                         Deaths >= 5) %>%
                  left_join(., day0, by = 'State') %>%
                  mutate(Date = Date - Day0),
                type = Deaths,
                top_states = top_n,
                ylab = 'Deaths',
                xlab = paste0('Days Past 5 Deaths\n\nData Pulled ', Sys.Date(), ' from Johns Hopkins CSSE'),
                title = 'COVID-19 Deaths by US State') +
  scale_x_continuous() +
  coord_trans(y = 'log10') +
  scale_y_continuous(breaks = c(10,25, 50, 100, 250, 500, 1000))
## Scale for 'x' is already present. Adding another scale for 'x', which will
## replace the existing scale.## Scale for 'y' is already present. Adding another scale for 'y', which will
## replace the existing scale.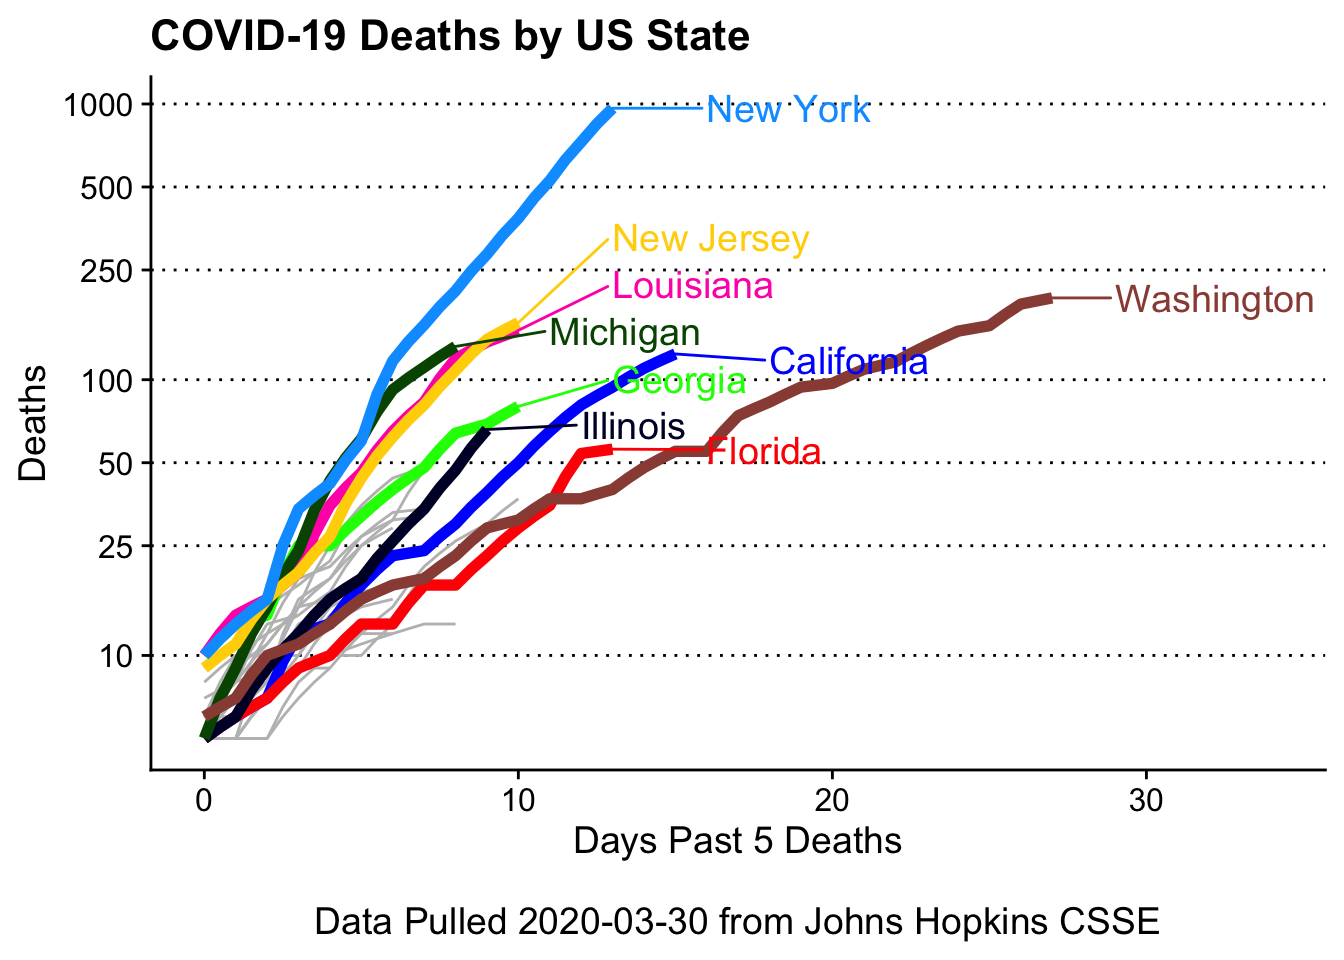
Add exponential lines
For deaths doubling every 2,and 4 days
# function to calculate cases/etc over user given double times (in days) and start values
growth_maker = function(start_day = 0, start_val = 5, doubles_every_n_days = 2, end_val = 5000){
  out <- cbind(start_day, start_val)
  vals = start_val
  days = start_day
  while(vals < end_val){
    vals = vals * 2
    days = days + doubles_every_n_days
    out <- rbind(out,
                 cbind(days, vals))

  }
  out <- as_tibble(out)
  colnames(out) <- c('Date', 'Deaths')
  out <- out %>% mutate(Date = as.difftime(Date, units = 'days'),
                        'State' = paste0('doubles ', doubles_every_n_days, ' days'))
  out
}

doubling_data = bind_rows(growth_maker(start_val = 10, end_val = 2000, doubles_every_n_days = 2),
                          growth_maker(start_val = 5, end_val = 2000, doubles_every_n_days = 4))

covid19_plotter(covid_usa %>%
                  filter(State %in% day0$State,
                         Deaths >= 5) %>%
                  left_join(., day0, by = 'State') %>%
                  mutate(Date = Date - Day0),
                type = Deaths,
                top_states = top_n,
                ylab = 'Deaths',
                xlab = paste0('Days Past 5 Deaths\n\nData Pulled ', Sys.Date(), ' from Johns Hopkins CSSE'),
                title = 'COVID-19 Deaths by US State') +
  scale_x_continuous() +
  scale_y_log10(breaks = c(10,30,100,300,1000)) +
  geom_line(data = doubling_data,
            aes(x=Date, y=Deaths,
                group = State,
                color = NULL,
                State = NULL),
            alpha = 0.2) +
  geom_text_repel(data = doubling_data %>%
                    group_by(State) %>%
                    top_n(n = 1, wt = Deaths),
                  aes(x = Date,
                      y = Deaths,
                      label = State), color = 'gray')
## Scale for 'x' is already present. Adding another scale for 'x', which will
## replace the existing scale.## Scale for 'y' is already present. Adding another scale for 'y', which will
## replace the existing scale.